Have you ever wondered what a day in the life of a Sustaining Engineer at Canonical looks like?
Well today, we are going to have a look into a particularly interesting case I worked from start to completion, as it demanded that I dive into the world of Linux performance analysis tools to track down and solve the problem.
The problem is that there is a large performance degradation when reading files from a mounted read-only LVM snapshot on the Ubuntu 4.4 kernel, when compared to reading from a standard LVM volume. Reads can take anywhere from 14-25x the amount of time, which is a serious problem.
Lets get to the bottom of this, and get this fixed.
Reproducing the Issue
First things first, in order to understand the problem, it is always a good idea to be able to reproduce it. This lets us see first hand what is happening, and gives us a good platform to perform tests on, so we can then see ourselves when we solve the problem.
Now, the machines in the case in question used NVMe drives, and when I went to reproduce locally in virtual machines with virtio based storage, I could not see the issue.
This suggested already that the problem could be in the NVMe subsystem, but with no idea where.
My computer doesn’t have any NVMe storage, so the easiest way to get ahold of a machine with NVMe storage is to use an instance in the cloud. In this case, all tests will be done with c5.large machines on Amazon EC2. Fast, and cost-efficient.
c5.large machines are nitro instances, and let you optionally attach NVMe storage, so for this test, attach a 200gb EBS volume when you create your instance.
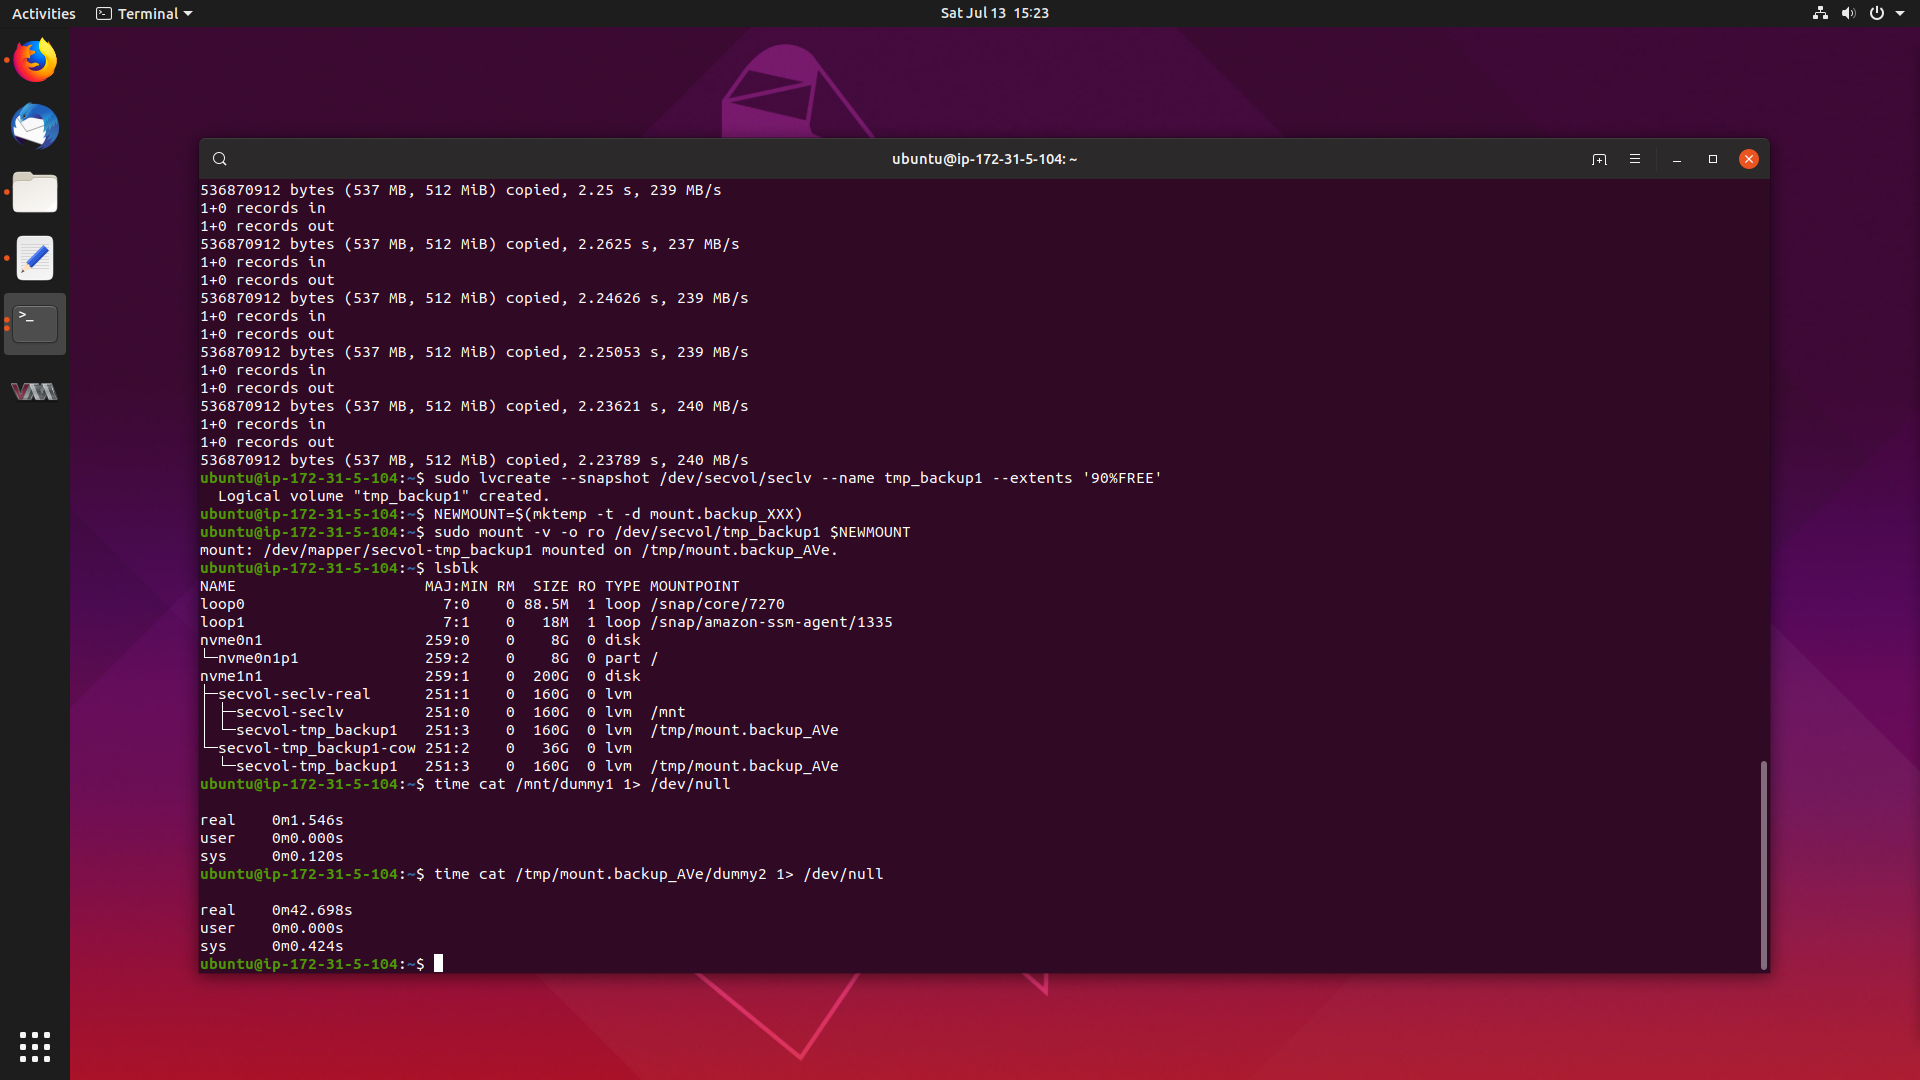
In this instance, our NVMe disk is /dev/nvme1n1, and the kernel we will be
testing is 4.4.0-1087-aws, since we are doing this on EC2.
To set our machine up, we can follow the steps below:
Steps (with NVMe disk being /dev/nvme1n1):
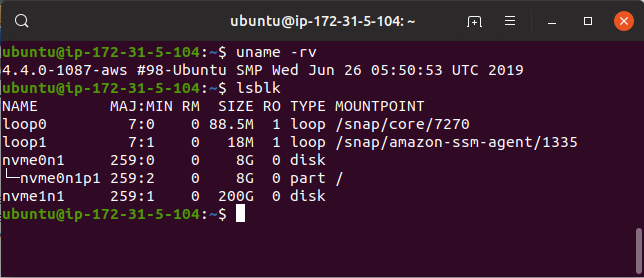
$ sudo pvcreate /dev/nvme1n1$ sudo vgcreate secvol /dev/nvme1n1$ sudo lvcreate --name seclv -l 80%FREE secvol$ sudo mkfs.ext4 /dev/secvol/seclv$ sudo mount /dev/mapper/secvol-seclv /mnt$ for i in `seq 1 20`; do sudo dd if=/dev/zero of=/mnt/dummy$i bs=512M count=1; done$ sudo lvcreate --snapshot /dev/secvol/seclv --name tmp_backup1 --extents '90%FREE'$ NEWMOUNT=$(mktemp -t -d mount.backup_XXX)$ sudo mount -v -o ro /dev/secvol/tmp_backup1 $NEWMOUNT
1), 2) and 3) set up a LVM volume group and volume on the NVMe drive, 4) and 5) creates a ext4 file system on the newly created volume and mounts it, 6) generates 20 files, filled with 512mb of random data each and writes it to the volume, 7) creates a snapshot of the volume with the files in it, and 8) and 9) mounts the snapshot as read-only.
Go ahead and run all of those commands on your instance, and afterwards lsblk
will look a little like this:
We can see the LVM groups and volumes span off of /dev/nvme1n1, so everything
ran correctly. What we are most interested in now are the mountpoints /mnt,
which holds the standard read-write volume, and /tmp/mount.backup_AVe, which
is where the LVM snapshot is mounted read-only.
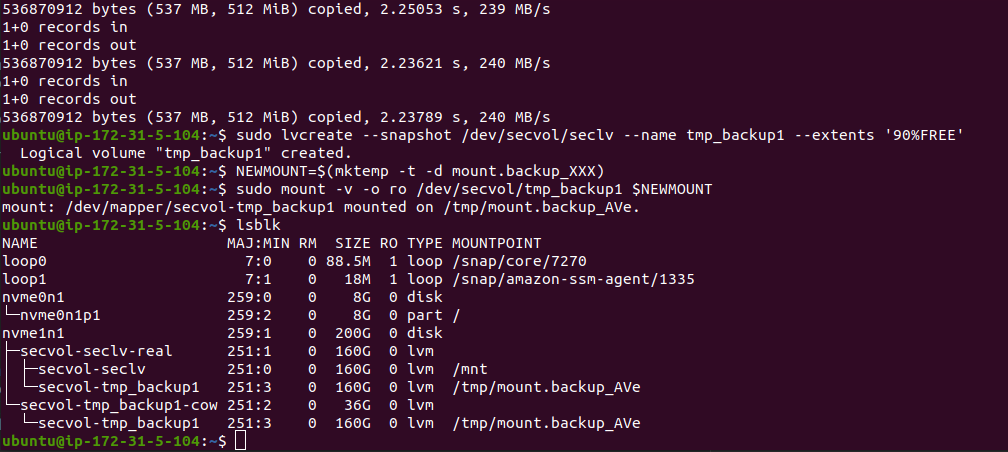
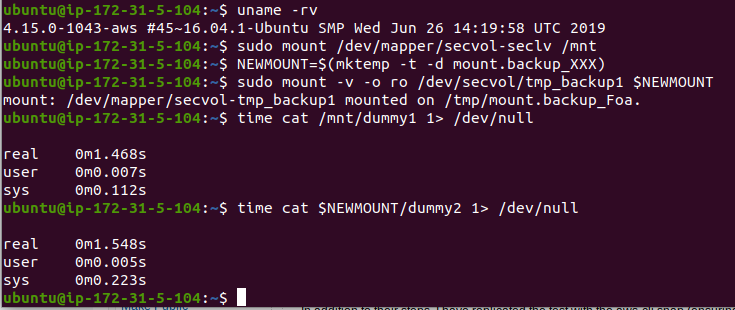
To reproduce, we just read a file from each mountpoint, and time how long it takes
to read. We can do this with $ time cat /mnt/dummy1 1> /dev/null and
$ time cat /tmp/mount.backup_AVe/dummy2 1> /dev/null. This reads file 1 from the
standard mountpoint, so we know how long it should take, and then reads file 2
from the LVM snapshot.
We choose different files so they don’t get cached by the system.
Woah! Look at that! It normally takes 1.546 seconds to read the 512mb file normally, but from the LVM snapshot, it takes 42.698 seconds. The read from the LVM snapshot is 27x slower! What on earth is going on here?
Finding a Workaround
One of the first things I try in this situation is seeing if upgrading the kernel to a newer version fixes the problem. If it is, great, we can then pinpoint the fix in git history and backport the patch to the 4.4 kernel, or if it isn’t then we may need to ask for subsystem maintainer help.
We are testing in a Ubuntu 16.04 virtual machine, which ships with the 4.4 kernel. The Hardware Enablement (HWE) kernel for 16.04 is currently the 4.15 kernel from Ubuntu 18.04. So let’s try installing that kernel.
You can run:
$ sudo apt-get install --install-recommends linux-aws-hwe
which will install the HWE kernel on this instance.
After rebooting, we can re-mount the volumes with:
$ sudo mount /dev/mapper/secvol-seclv /mnt$ NEWMOUNT=$(mktemp -t -d mount.backup_XXX)$ sudo mount -v -o ro /dev/secvol/tmp_backup1 $NEWMOUNT
Let’s see what the performance is like on this kernel:
Interesting, performance appears to have been restored. The LVM snapshot is ~0.1 seconds slower, but that pales in comparison to what it was before.
It seems we have our workaround. Those affected and need a solution right this minute can install the HWE kernel while a solution is found, engineered and released.
Searching for the Root Cause
It’s time to start looking for what caused this, so we can get this fixed in the 4.4 kernel.
Narrowing Down Good and Bad Kernel Versions
We know that the 4.4 kernel is bad, and the 4.15 kernel is good. Doing a git bisect between this many versions of the kernel will take literally forever.
We need to narrow down the range. We will do this by installing some prebuilt mainline kernels.
My goto tool is ukuu (Ubuntu kernel Update Utility). This pulls in kernels from kernel.ubuntu.com and makes installing them easy.
You can enable the ukuu ppa and install it with:
$ sudo add-apt-repository ppa:teejee2008/ppa
$ sudo apt-get update && sudo apt-get install ukuu
From there, you can get a list of kernels with sudo ukuu --list:
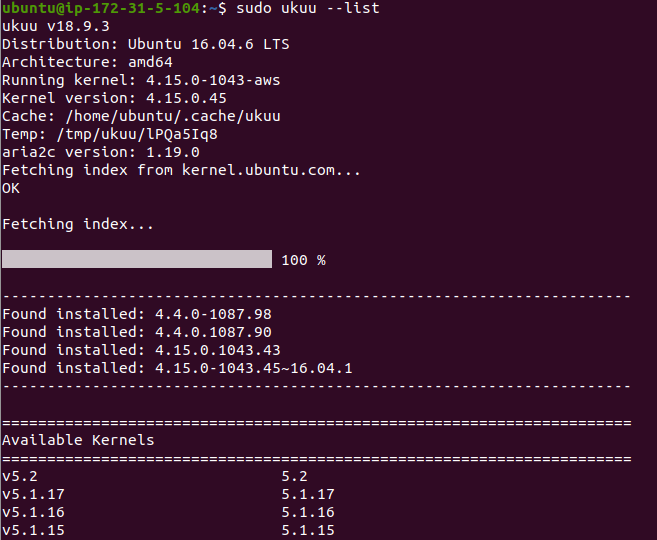
I think we will try something in the middle of 4.4 to 4.15. Let’s try 4.9:
$ sudo ukuu --install v4.9
You will have to edit grub to select 4.9, but I won’t show that here.
Looking at the performance of 4.9 and also 4.8, we see:
xenial 4.9.0-040900-generic #201612111631

real 0m1.625s
user 0m0.005s
sys 0m0.216s

xenial 4.8.0-39-generic #42~16.04.1-Ubuntu

real 0m1.668s
user 0m0.006s
sys 0m0.221s
Hmm. This means that the problem was now fixed somewhere between 4.4 (bad) and 4.8 (good).
At this point I was struggling to get mainline kernels between 4.5 and 4.8 to boot on aws. It seems the Elastic Network Adapter (ena) module was mainlined in 4.9, and backported to the 4.8 Ubuntu kernel, which is how I got the above results.
But it made it impossible to get to anything below this. One of my colleagues managed to extract ena from 4.4 and forward port it to 4.5 for another case, so I used it to get 4.6 going by building a custom kernel.
This kernel had similar performance:
xenial - 4.6.0+ #2

real 0m1.508s
user 0m0.005s
sys 0m0.360s
We know now the fix is either in Linux 4.5 or 4.6. Now we just need to narrow down the root cause, find the commit and backport it.
Generating Flame Graphs with perf
The next step in the debugging process is to look at what functions are taking the most time in the kernel. If something that takes 1.5 seconds normally now suddenly takes 45 seconds, we should see a particular function call take more time, which could lead us to the solution.
For this, we are going to look at Brendan Gregg’s incredible flame graph tool.
To get this set up, we can run:
$ sudo apt-install linux-tools-aws
$ git clone https://github.com/brendangregg/FlameGraph
$ cd FlameGraph
$ sudo -s

# Record the standard case
$ perf record -F 99 -a -g -- cp /mnt/dummy1 /dev/null
$ perf script | ./stackcollapse-perf.pl > out.perf-folded
$ ./flamegraph.pl out.perf-folded > 4.4-standard.svg

# Delete data files
$ rm perf.data
$ rm out.perf-folded

# Record snapshot case
$ perf record -F 99 -a -g -- cp /tmp/mount.backup_6hp/dummy2 /dev/null
# perf script | ./stackcollapse-perf.pl > out.perf-folded
$ ./flamegraph.pl out.perf-folded > 4.4-snapshot.svg
This runs perf against our two test
scenarios, one for the standard LVM read, and one for the LVM snapshot read.
I changed cat to cp for better looking graphs. cat seems to chop the graph
up into two sections in the read() system call, so I went with cp instead.
I have provided the flamegraphs below. They are interactive, and I recommend you have a play with them!
4.4 Standard LVM Read
4.4 LVM Snapshot Read
4.6 Standard LVM Read
4.6 Snapshot Read
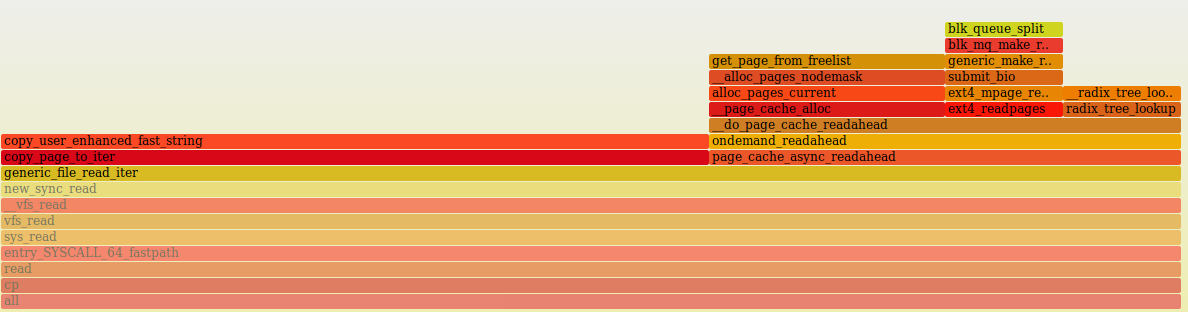
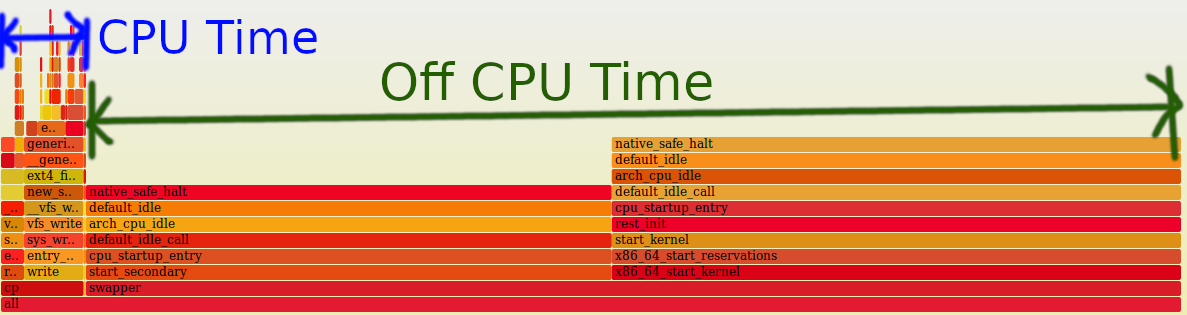
Flame graphs enable you to drill down into exactly where the kernel spends most
of its time. When we first open the flamegraph, we see two bars above all.
These are cp the process we are looking at and swapper, which is the system.
We are interested in what functions are getting called as a result of the copy,
so click cp.
If you click around in the write system call space, we see that between the
standard copy and the snapshot copy they are more or less the same, and coupled
with the fact that cat to /dev/null has no performance problems, so we will
focus our efforts elsewhere.
Comparing the 4.4 standard and snapshot read side, we see a clear difference
after the call to generic_file_read_iter():
4.4 Standard Read
4.4 Snapshot Read
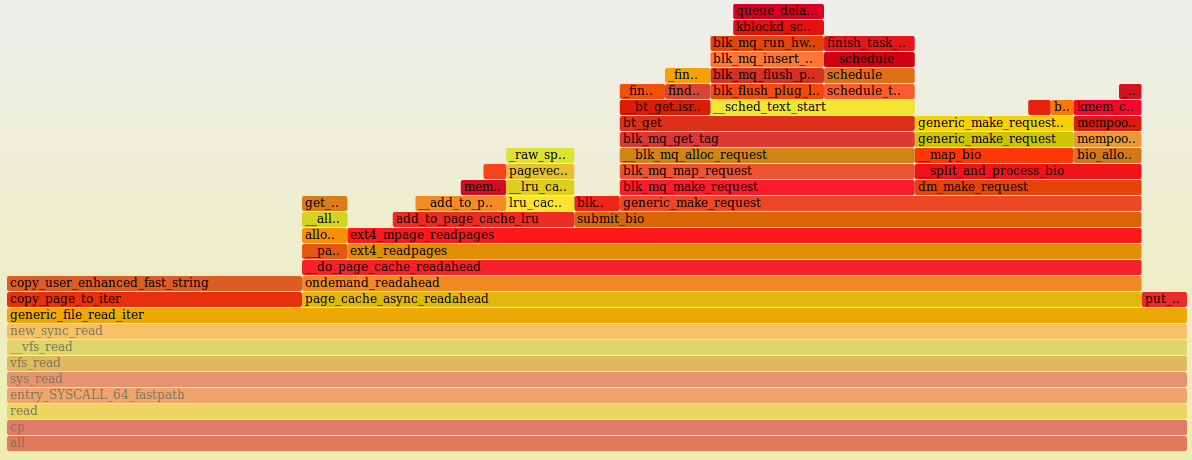
Everything changes after __do_page_cache_readahead(). On the snapshot side,
we see a nested call to generic_make_request() which is not on the standard
graph, as well as a lot of calls to blk_mq() related functions.
The strange thing is that the horizontal width of the bars aren’t all that telling. We can’t determine if a specific function is taking a lot of time up because it appears we are spending a lot of time off-cpu.
We can see this by zooming out all the way:
4.4 Standard Read
4.4 Snapshot Read
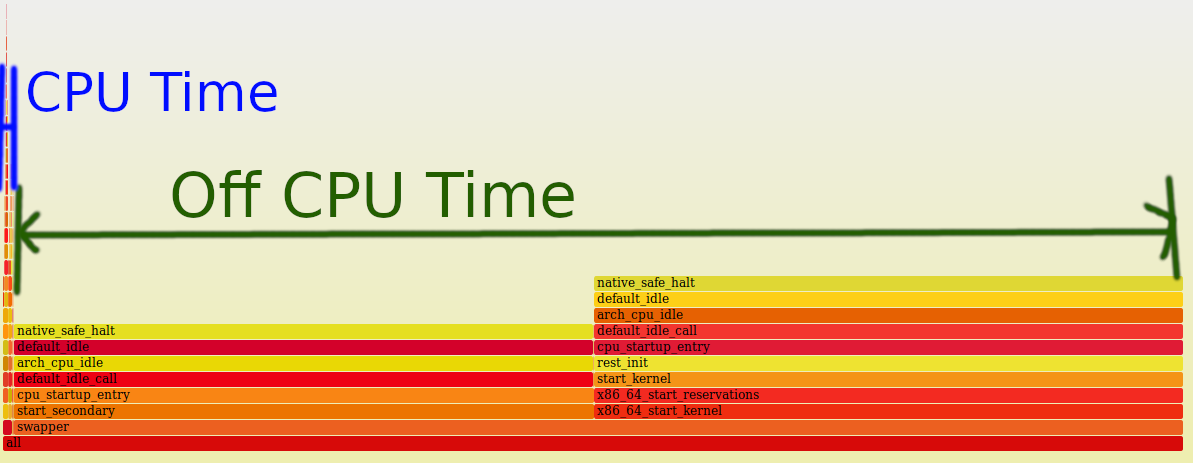
I tried to generate a off-cpu time flamegraph, but the results aren’t really that useful:
4.4 LVM Snapshot Read
Hmm. From what we have learned in this section, is that the read operation is
spending a lot of time off-cpu, and the snapshot case involves a lot more
complexity, especially with generic_make_request() and blk_mq() functions.
We need to change strategy once again.
Capturing and Analysing Events with perf
I went and asked a technical director in my team for some help, since I was very stuck at this point in time. He suggested we look at block inserts and completions when the driver places requests onto the queue (insert), and then when the driver says the request has been completed (completion).
We can gather that data in perf by running the following:
$ perf record -a -e block:block_rq_insert -e block:block_rq_complete \
      -- time cat /mnt/dummy5 1> /dev/null
real 0m1.522s
user 0m0.004s
sys 0m0.120s
and
$ perf record -a -e block:block_rq_insert -e block:block_rq_complete \
      -- time cat /tmp/mount.backup_yut/dummy6 1> /dev/null
real 0m42.695s
user 0m0.000s
sys 0m0.372s
If we run perf script we get output like below:
swapper 0 [001]  5502.478884: block:block_rq_complete: 259,1 RS () 340080 + 8 [0]
swapper 0 [001]  5502.479253: block:block_rq_complete: 259,1 RS () 340088 + 8 [0]
swapper 0 [001]  5502.479584: block:block_rq_complete: 259,1 RS () 340096 + 8 [0]
cat  1942 [001]  5502.479591: block:block_rq_insert: 259,1 RS 0 () 340328 + 8 [cat]
cat  1942 [001]  5502.479591: block:block_rq_insert: 259,1 RS 0 () 340336 + 8 [cat]
cat  1942 [001]  5502.479591: block:block_rq_insert: 259,1 RS 0 () 340344 + 8 [cat]
This is for the snapshot case. In the above example, we can see requests for particular sectors, such as 340080, how many sectors at a time, such as 8, and timestamps for requests and completions.
We then ran each perf.data file through this awk script, to figure out the
latency of each request from insertion to completion.
#!/usr/bin/awk -f

/block_rq_complete/ {
     sector=$9
     t_stop[sector] = $4 + 0.0;
#    printf("sec %d t %f\n", sector, t_stop[sector]);
}
/block_rq_insert/ {
     sector=$10
     t_start[sector] = $4 + 0.0;
#    printf("ins sec %d t %f\n", sector, t_start[sector]);
}
END {
    for (x in t_start) {
        printf("%f sector %d start %f stop %f lat %f\n",
        t_stop[x] - t_start[x], x, t_start[x],
        t_stop[x], t_stop[x] - t_start[x]);
    }
}
What is interesting is that the latency of the snapshot reads are significantly higher than a standard read.
Standard LVM read: Min time: 0.000357 Max time: 0.005906
LVM Snapshot read: Min time: 0.000286 Max Time: 0.024759
98% of the latency records in the snapshot copy are significantly higher.
Not only that, the number of requests for sector accesses are higher:
$ wc -l standard_sorted_latency.txt
2049 standard_sorted_latency.txt

$ wc -l snapshot_sorted_latency.txt
131194 snapshot_sorted_latency.txt
This now tells us that the snapshot scenario is making significantly higher amount of requests to the NVMe driver, and each request has a higher latency, slowing things down further.
Now we need to understand why these extra requests are being made, and how we can resolve it.
Looking at Disk Activity with iostat
We then ran iostat to try and determine what bottlenecks these extra requests
are causing.
For the standard copy from /mnt the output is:
$ iostat -xk 5
Device:      r/s     rkB/s  avgrq-sz avgqu-sz  await r_await  svctm  %util
nvme1n1   409.60 104857.60    512.00     0.21   0.98    0.98   0.50  20.64
dm-0      409.60 104857.60    512.00     0.40   0.98    0.98   0.51  20.96
dm-1      409.60 104857.60    512.00     0.40   0.98    0.98   0.51  20.96
dm-2        0.00      0.00      0.00     0.00   0.00    0.00   0.00   0.00
dm-3        0.00      0.00      0.00     0.00   0.00    0.00   0.00   0.00
The interesting thing here is that dm-1, dm-0 and nvme1n1 all have a average request size of 512.0 sectors at a time, as seen under avgrq-sz. There are 409.60 requests per second, for 104857.60 kb/sec copy.
Now, looking at the problematic snapshot copy case:
$ iostat -xk 5
Device:      r/s     rkB/s  avgrq-sz avgqu-sz  await r_await  svctm  %util
nvme1n1  3000.00  12000.00      8.00    30.10  10.03   10.03   0.33 100.00
dm-0        0.00      0.00      0.00     0.00   0.00    0.00   0.00   0.00
dm-1     3000.40  12001.60      8.00    31.10  10.37   10.37   0.33 100.00
dm-2        0.00      0.00      0.00     0.00   0.00    0.00   0.00   0.00
dm-3       47.00  12032.00    512.00     1.48  31.49   31.49  21.28 100.00
We now see that we are reading 512 sectors at a time from the LVM snapshot, dm-3. But as we go up the layers, like the standard LVM volume of dm-1 where the COW data is stored, and to the nvme1n1 device, the average sector access is only 8 sectors at a time!
This makes requests increase to 3000 requests per second, and for a much lower transfer rate of 12000 kb/sec.
The kernel maintains queues for requests, and they must be getting saturated
with those small 8 sector requests. That must be why the %util column is
showing 100%, compared to 21% for the standard case.
Let’s see what the 4.15 HWE kernel does in this situation:
$ iostat -xk 5
Device:      r/s       rkB/s  avgrq-sz avgqu-sz await r_await  svctm  %util
nvme1n1   406.00   103936.00    512.00     0.29  1.39    1.39   0.72  29.20
dm-0    25958.40   103833.60      8.00    35.38  1.36    1.36   0.01  30.32
dm-1        0.00        0.00      0.00     0.00  0.00    0.00   0.00   0.00
dm-2        0.00        0.00      0.00     0.00  0.00    0.00   0.00   0.00
dm-3    25958.40  3374592.00    260.00    35.40  1.36    1.36   0.01  30.32
The 4.15 kernel issues an average of 260 sector reads at a time, with 8 sectors at the LVM volume dm-0, and then finally 512 sectors at the nvme1n1 device.
My, my. That is very strange indeed. But performance is restored in this kernel, so it must be the 8 sector vs 512 sector requests at the nvme drive itself which is causing the issues.
We have now discovered why the extra requests are being made. As requests are passed down storage layers, we seem to be doing smaller requests of 8 sectors at a time vs 512 sectors at a time.
But why? How do we fix this?
Tracing Drive Accesses with btrace
The next logical step is to trace each drive access as it goes through the file system layers and makes it way to the NVMe driver, which will then issue commands to the device itself.
This can be achieved with blktrace, and in this scenario I will be using the
more user friendly version btrace.
I used two ssh sessions to capture data. One runs the cat command to read the
file, and the other runs btrace.
First tty:
$ cat /mnt/dummy1 1> /dev/null
or
$ cat /tmp/mount.backup_OXV/dummy2 1> /dev/null

Second tty:
# btrace /dev/nvme1n1 > trace.data
The below key is used to determine the actions performed by the kernel. You can see the letters in the 6th column of btrace output.
A = IO remapped to different device
Q = IO handled by request queue
G = Get request
U = Unplug request
I = IO inserted onto request queue
D = IO issued to driver
C = IO completion
Running the standard case of the normal LVM read, we see:
259,0    1       13     0.002545516  1579  A   R 280576 + 512 <- (252,0) 278528
259,0    1       14     0.002545701  1579  Q   R 280576 + 512 [cat]
259,0    1       15     0.002547020  1579  G   R 280576 + 512 [cat]
259,0    1       16     0.002547631  1579  U   N [cat] 1
259,0    1       17     0.002547775  1579  I  RS 280576 + 512 [cat]
259,0    1       18     0.002551381  1579  D  RS 280576 + 512 [cat]
259,0    1       19     0.004099666     0  C  RS 280576 + 512 [0]
Firstly, the request is mapped from a different device, from /mnt which is dm-1 to the nvme disk. A 512 sector read is placed on the IO request queue, where it is then inserted into the driver request queue and then the driver is commanded to fetch the data, and then it completes.
Seems normal enough. Now to the snapshot case:
259,0    1      113     0.001117160  1606  A   R 837872 + 8 <- (252,0) 835824
259,0    1      114     0.001117276  1606  Q   R 837872 + 8 [cat]
259,0    1      115     0.001117451  1606  G   R 837872 + 8 [cat]
259,0    1      116     0.001117979  1606  A   R 837880 + 8 <- (252,0) 835832
259,0    1      117     0.001118119  1606  Q   R 837880 + 8 [cat]
259,0    1      118     0.001118285  1606  G   R 837880 + 8 [cat]
259,0    1      122     0.001121613  1606  I  RS 837640 + 8 [cat]
259,0    1      123     0.001121687  1606  I  RS 837648 + 8 [cat]
259,0    1      124     0.001121758  1606  I  RS 837656 + 8 [cat]
...
259,0    1      154     0.001126118   377  D  RS 837648 + 8 [kworker/1:1H]
259,0    1      155     0.001126445   377  D  RS 837656 + 8 [kworker/1:1H]
259,0    1      156     0.001126871   377  D  RS 837664 + 8 [kworker/1:1H]
...
259,0    1      183     0.001848512     0  C  RS 837632 + 8 [0]
Now what is happening here, is that a request for a 8 sector read is placed onto the IO request queue, and is then inserted one at a time to the driver request queue and then fetched by the driver. This is very inefficient as the driver has to complete many many more requests of 8 sectors at a time, vs just one request of 512 sectors at a time from the standard LVM copy.
The next thing to do is check what a fixed kernel does. The below is what a 4.15 HWE or 4.6+ Linux kernel would do:
M = IO back merged with request on queue
This time there is a new letter, M:
259,0    0      194     0.000532515  1897  A   R 7358960 + 8 <- (253,0) 7356912
259,0    0      195     0.000532634  1897  Q   R 7358960 + 8 [cat]
259,0    0      196     0.000532810  1897  M   R 7358960 + 8 [cat]
259,0    0      197     0.000533864  1897  A   R 7358968 + 8 <- (253,0) 7356920
259,0    0      198     0.000533991  1897  Q   R 7358968 + 8 [cat]
259,0    0      199     0.000534177  1897  M   R 7358968 + 8 [cat]
259,0    0      200     0.000534474  1897 UT   N [cat] 1
259,0    0      201     0.000534586  1897  I   R 7358464 + 512 [cat]
259,0    0      202     0.000537055  1897  D   R 7358464 + 512 [cat]
259,0    0      203     0.002242539     0  C   R 7358464 + 512 [0]
This shows us a 8 sector read is added to the request queue, and is then subsequently [M]erged backward with other requests on the queue until the sum of all of those merged requests becomes 512 sectors. From there, the 512 sector read is placed onto the IO queue, where it is fetched by the device driver, and completes.
The core problem is that the 4.4 xenial kernel is not merging 8 sector requests.
Finding the Commit With the Fix
After digging in git log between 4.4 and 4.6, this commit stood out:
commit 9c573de3283af007ea11c17bde1e4568d9417328
Author: Shaohua Li <[email protected]>
Date: Mon Apr 25 16:52:38 2016 -0700
Subject: MD: make bio mergeable
You can read it here: https://github.com/torvalds/linux/commit/9c573de3283af007ea11c17bde1e4568d9417328
“blk_queue_split marks bio unmergeable, which makes sense for normal bio.
But if dispatching the bio to underlayer disk, the blk_queue_split
checks are invalid, hence it’s possible the bio becomes mergeable.”
The snapshot is dm-3, and it has two underlayer disks, dm-1 and nvme1n1. Which means we qualify for merging.
Looking at the xenial 4.4 kernel tree, this commit is actually already applied, since it got backported to the mainline 4.4 kernel:
https://www.mail-archive.com/[email protected]/msg1141165.html
So why is xenial still effected? Looking at the bugzilla page for this bug:
https://bugzilla.kernel.org/show_bug.cgi?id=117051
We see that merging is controlled by a sysfs entry,
/sys/block/nvme1n1/queue/nomerges
On 4.4 xenial, reading from this yields 2, or QUEUE_FLAG_NOMERGES.
On 4.6+ and 4.15 HWE kernel, reading from this yields 0, or allowing merge.
Setting this to 0 on the 4.4 kernel with:
# echo "0" > /sys/block/nvme1n1/queue/nomerges
and retesting shows:
$ time cat /tmp/mount.backup_aId/dummy1 1> /dev/null

real 0m1.773s
user 0m0.008s
sys 0m0.184s
$ cat /sys/block/nvme1n1/queue/nomerges
0
Performance is restored. Now isn’t that interesting. We just need to determine
what commit changes the setting of QUEUE_FLAG_NOMERGES and backport that.
Note, this is also a second workaround, and one that does not require anyone to upgrade their kernel. They can just change the sysctl entry and be done.
We go and run cscope over the xenial kernel tree, and search for
QUEUE_FLAG_NOMERGES to see what we can find:
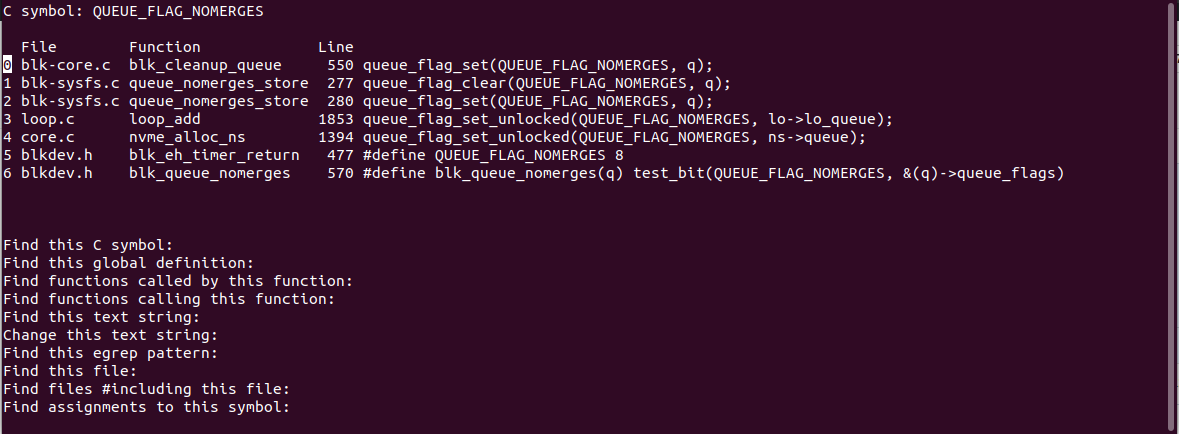
I looked through each of the files, and examined where the flag was set and
cleared. This one in drivers/nvme/host/core.c caught my eye in
nvme_alloc_ns():
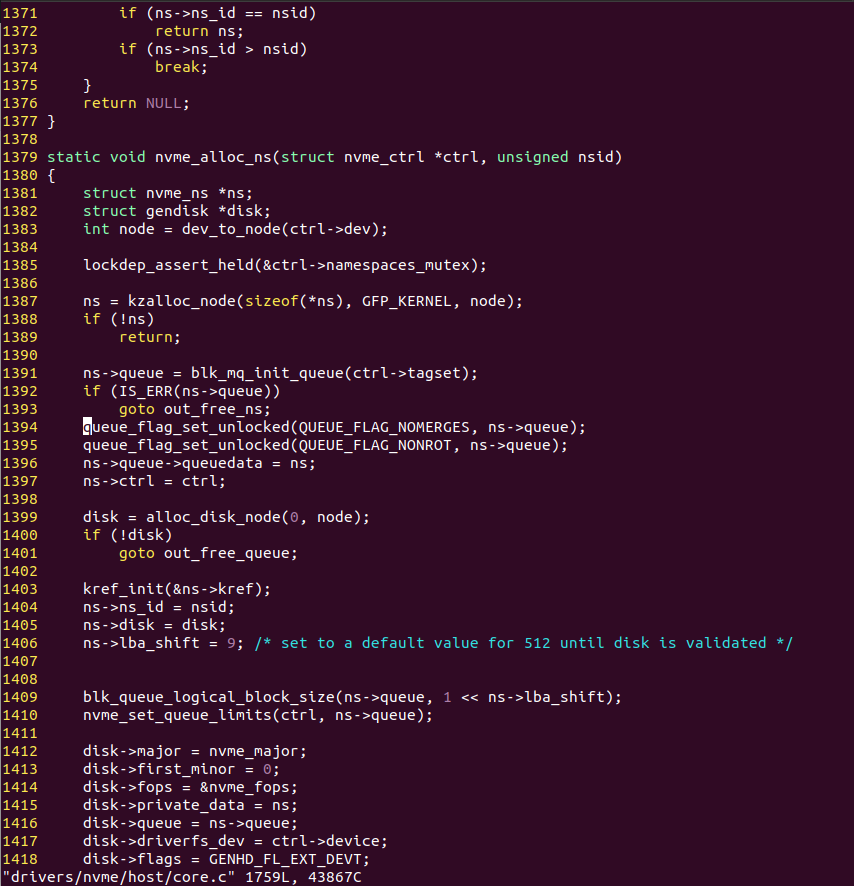
nvme_alloc_ns() is called during device initialisation, and sets two flags,
QUEUE_FLAG_NOMERGES and QUEUE_FLAG_NONROT.
Looking at the 4.6 kernel tree, this line is missing. How interesting.
I then started doing a simple bisect on github for drivers/nvme/host/core.c
and I found this commit:
commit ef2d4615c59efb312e531a5e949970f37ca1c841
Author: Keith Busch <[email protected]>
Date: Thu Feb 11 13:05:40 2016 -0700
Subject: NVMe: Allow request merges
You can read it here:
https://github.com/torvalds/linux/commit/ef2d4615c59efb312e531a5e949970f37ca1c841
This commit was introduced in Linux 4.5, which is in our window of 4.4 (bad) to 4.6 (good), and removes the line where the nomerges flag was being set.
I went and built a test kernel containing the commit, and looking at performance:
4.4.0-1084-aws

$ time cat /tmp/mount.backup_ZHx/dummy1 1> /dev/null

real 0m42.693s
user 0m0.000s
sys 0m0.392s
$ cat /sys/block/nvme1n1/queue/nomerges
2

4.4.0-1084-aws #94+hf228435v20190617b1

$ time cat /tmp/mount.backup_kQc/dummy2 1> /dev/null

real 0m1.568s
user 0m0.008s
sys 0m0.196s
$ cat /sys/block/nvme1n1/queue/nomerges
0
It seems we have the commit which fixes the root cause. Fantastic!
Going Through the Stable Release Update Process
Time to land the fix in the kernel. To do this, we follow the Stable Release Updates procedure, and follow the special kernel specific rules.
This involves opening a launchpad bug and fill out a SRU template:
And then submitting the patches to the Ubuntu kernel mailing list:
From there it gets reviewed by the kernel team, and ACKed:
If a patch gets ACKed twice, it will be applied and included:
From there, the patch made its way to -proposed in 4.4.0-155.182 and 4.4.0-1088-aws kernels, and I tested them and verified that they worked.
On Monday 22nd July, the 4.4.0-155.182 kernel was released to -updates, so if you are reading this and running xenial, you will be running a fixed kernel.
Conclusion
There you go. We managed to determine the root cause of some pretty bad performance degradation in relation to using LVM snapshots on NVMe devices, and push a fix out.
Debugging the problem was kind of hard, and but at each step we learned something new, although it took all steps and a look at the bigger picture to find the root cause of requests not being merged on the drivers queue.
This took me a week or two to go from start to finish, and I asked for help a lot along the way. I learned how to use perf pretty well, how to generate flame graphs and use block tracing.
This is a pretty good representation of what Sustaining Engineers do day to day, and I hope you enjoyed the read.
If you have any questions, you can contact me.
Matthew Ruffell